JConsole |
JConsole, which is a part of the Java Development Kit (JDK) is a graphical monitoring tool used to monitor the Java Virtual Machine (JVM) and java applications. The JConsole monitors on a local as well as on a remote machine.
The JConsole uses underlying features of Java Virtual Machine(JVM) to provide information on performance and resource consumption of applications running on the Java platform. JConsole can be started using "jconsole" command.
The JConsole interface consists of six tabs as shown below:
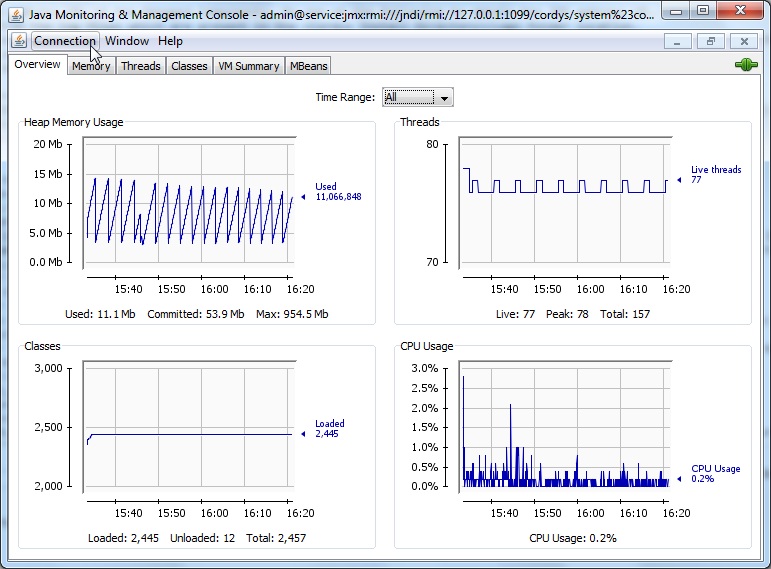
Overview:Provides the graphical view of the data related to JVM such as CPU Usage, Heap Memory Usage, Threads and classes.
Memory: Displays the information about the usage of memory in the form of graphs.
Threads: Displays the names and states of the threads used.
Classes: Displays the information about the classes such as number of loaded classes and total number of classed unloaded and so on.
VM Summary: Briefs about the data related to JVM such as Connection name, Operating system, architecture and so on.
MBeans: Contains the Managed Components of Process Platform that must be monitored and managed by the administrator. The managed components of Process Platform are described in MBeans.
For more information about JConsole see here.